Hospitality business health check: the KPIs that actually matter
A business health check tells an operator whether the business is healthy and what to do next — not just what happened. Here are the KPIs that matter, their healthy benchmark ranges, and how to turn them into action.
· 9 min read
A hospitality business health check is a structured review of the metrics that determine whether a venue is financially healthy — food cost, labour cost, prime cost, average order value, and margin — each measured against an industry benchmark, then translated into specific actions. It is different from a dashboard. A dashboard shows what happened; a health check tells you whether that is good, what it is costing you, and what to do about it.
Most reporting stops at the first layer. This guide covers all three: the vital signs (the KPIs and their healthy ranges), the diagnosis (what a number actually means in money), and the prescription (the prioritised actions that follow). All benchmark ranges below are standard industry figures for restaurants, cafes, and hotels.
The three layers of a real health check
A genuine health check has three layers. Layer one is the vital signs — each KPI scored against a healthy band, like a traffic light. Layer two is the diagnosis — what is off, and what the gap is costing per month. Layer three is the prescription — a short, prioritised list of actions tied directly to the numbers. Charts alone are layer zero. The value is in layers two and three.
Vital signs: the restaurant KPIs that matter
For a restaurant, cafe, or multi-venue food business, these are the numbers that determine whether the business is healthy, with their standard benchmark ranges:
- Food cost percentage — 25–35% of food sales overall (25–30% for quick-service, 30–34% for casual dining, 34–40% for fine dining). 28–32% is considered good performance.
- Labour cost percentage — 25–35% of total sales, varying between full-service and quick-service formats.
- Prime cost (food + labour combined) — the single most important control number. Healthy range is 55–65%, with a target of staying under 65%.
- Net profit margin — a realistic 3–8%. Restaurants are a thin-margin business, which is exactly why cost control matters so much.
- Average order value (AOV) — revenue divided by number of orders. Growing it lifts revenue with no extra footfall.
- Covers and table turnover — how many customers you serve per service period, and how often each table is reseated.
Prime cost is the headline. If you track one traffic-light number, make it prime cost against the under-65% target — it captures your two largest controllable costs in one figure.
Vital signs: the hotel KPIs that matter
For hotels, the health-check metrics are different but the principle is identical — measure against a benchmark band for your property type:
- Occupancy rate — target 68–78% for full-service urban hotels, 75–85% for extended-stay, and 55–70% for resorts (which are seasonal).
- ADR (average daily rate) — total room revenue divided by rooms sold; the measure of pricing power.
- RevPAR (revenue per available room) — ADR multiplied by occupancy; the primary profitability KPI.
- GOP margin (gross operating profit) — the core operational profitability measure, typically in the high-30s percent for well-run properties.
- Labour cost — kept below 35% of revenue.
Diagnosis: turn a number into money
A benchmark on its own does not drive action. The diagnosis layer converts each amber or red vital sign into a monthly cost. "Prime cost is 68%" means little to a busy operator. "Prime cost is 68% against a 65% target — that is roughly £3,000 a month on £100,000 of revenue, and the driver is labour on Tuesday-to-Thursday mornings" is something you can act on today. The maths is simple; presenting it in money terms is what makes it land.
Prescription: the actions that follow
Once the diagnosis is clear, the actions usually fall into a few well-understood levers, each with a known impact:
- Menu engineering — classifying items by margin and popularity and acting on each. Done consistently it adds 10–15% to the bottom line. Around 80% of sales typically come from just 16% of menu items, so the priorities are few.
- Menu placement — high-margin items in the menu's "Golden Triangle" get around 60% higher selection; boxing or adding an icon to an item lifts it about 18%.
- Bundling and combos — combo deals reach 35–50% of orders and add $4–6 to average order value.
- Digital menus and kiosks — lift average order value 15–30% because the screen always offers the add-on.
- Loyalty — members spend 12–25% more annually in restaurants (about 22% more in hotels), and a well-run programme returns 35–65% in year one, rising to 150–300%+ from year two.
Prioritising the prescription
Not every action is equal. A good health check ranks recommendations by impact and speed: quick wins first (menu highlighting, staff upselling, vendor re-costing — days to weeks), then strategic initiatives (loyalty launch, full menu overhaul — one to three months), then infrastructure (the systems that unlock everything else). The point is to focus limited operator attention on the two or three changes that move the most money soonest.
How intraQ runs the health check automatically
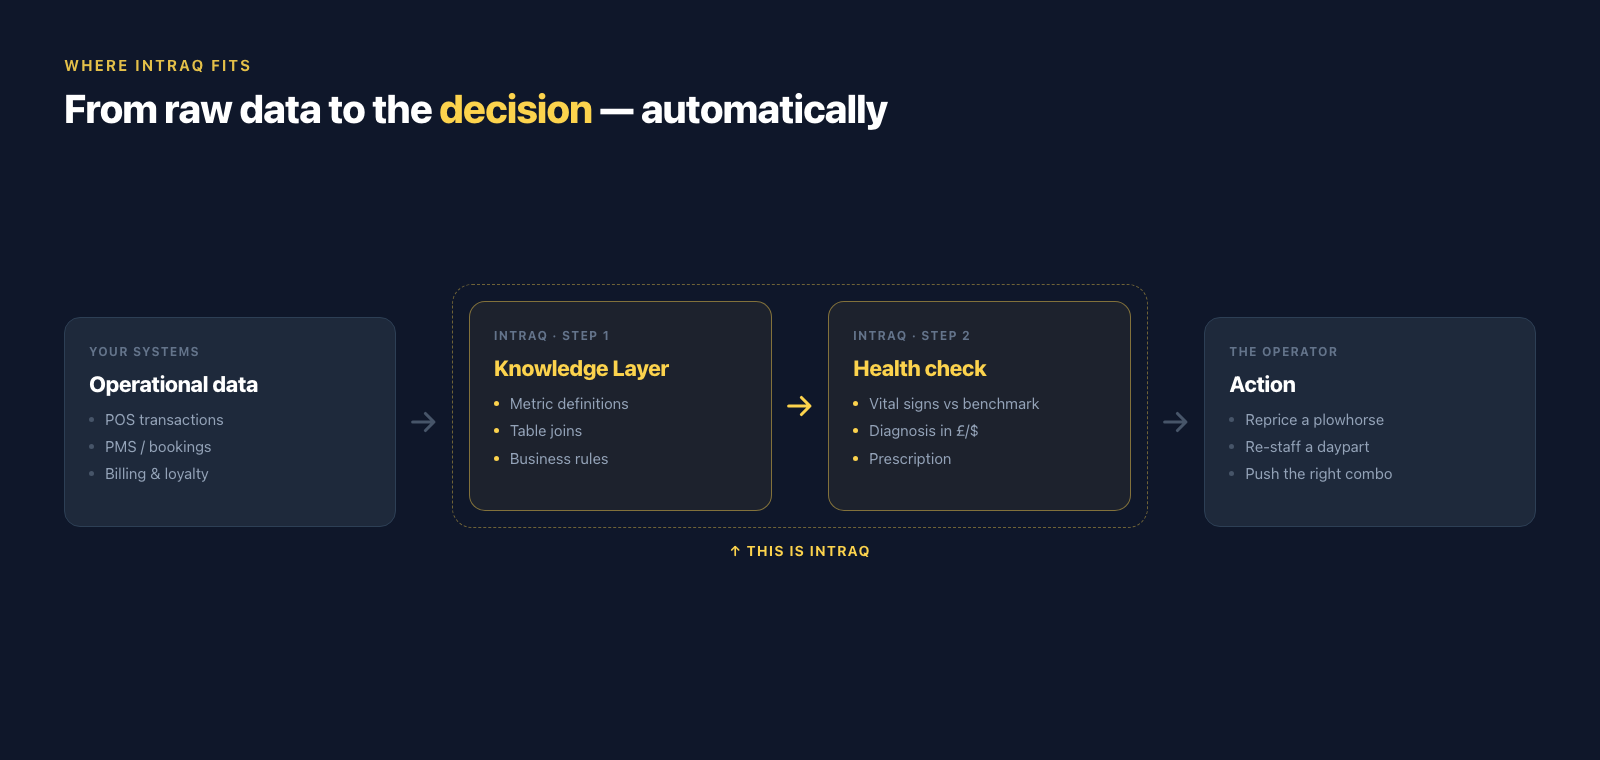
Every metric above is computable directly from the POS or PMS data intraQ already reads. Because intraQ grounds answers in a defined data model — your metric definitions and business rules — it can score each vital sign against its benchmark, quantify the gap in money, and surface the prescription, all from a plain-English question. It closes the loop from data to decision, which is the part a generic BI dashboard leaves to you.
Frequently asked questions
What is a hospitality business health check? It is a structured review of the KPIs that determine financial health — food cost, labour cost, prime cost, average order value, and margin — each compared to an industry benchmark and turned into a prioritised action list, rather than just a set of charts.
What is a healthy prime cost for a restaurant? Prime cost — food cost plus labour cost — should sit in the 55–65% range, with under 65% the standard target. It is the single most important profitability control number because it captures the two largest controllable costs together.
What is a good food cost percentage? Around 25–35% of food sales overall — 25–30% for quick-service, 30–34% for casual dining, and 34–40% for fine dining. 28–32% is generally considered good performance.
How do I increase average order value in hospitality? The most effective proven levers are menu engineering (10–15% bottom-line impact), high-margin menu placement (about 60% higher selection), combo bundling (+$4–6 per order), digital menus (15–30% AOV lift), and loyalty programmes (members spend 12–25% more).