Hospitality reporting: what to report, when, and how to stop doing it manually
Good hospitality reporting is not a monthly spreadsheet — it is the right numbers, at the right cadence, in front of the right person. Here is what to report daily, weekly, and by period, and how to automate it.
· 9 min read
Hospitality reporting is the practice of turning POS and PMS data into a regular, structured view of how the business is performing — daily trading, weekly trends, and period-level profitability — so operators can act on it. Done well, it is the nervous system of a venue or group. Done the usual way — exporting to a spreadsheet once a month — it is a rear-view mirror that shows you problems long after you could have fixed them.
This guide covers the reports that actually matter in hospitality, the cadence each one belongs to, who it is for, and how to move from manual reporting to something automated and trustworthy.
Why manual reporting quietly costs you money
The typical reporting cycle looks like this: export POS data, clean it in a spreadsheet, build the comparison, spot the problem — by which point the week is over and the moment to act has passed. Manual reporting has three failure modes. It is slow, so decisions are always late. It is fragile, because one renamed venue or broken formula corrupts the numbers. And it is backward-looking, so you end up managing on last month's data instead of this morning's. The reporting itself is not the goal — the decision it enables is, and manual reporting kills the decision by delivering it too late.
The three reporting cadences
Hospitality reporting works best in three layers, each answering a different question for a different person.
Daily: the trading report
The daily trading report answers "how did we do yesterday, and is anything off?" It is for the venue manager or GM, first thing in the morning. It should cover net sales, covers, average spend, and labour as a percentage of sales, each against the same day last week and the target. The point is exception-spotting: a manager should be able to glance at it and know whether today needs any intervention.
- Net sales vs same day last week and vs target
- Covers and average spend — is a change coming from footfall or basket size?
- Labour % of sales against the healthy 25–35% range
- Refunds, voids, and discounts as a quick integrity check
Weekly: the performance report
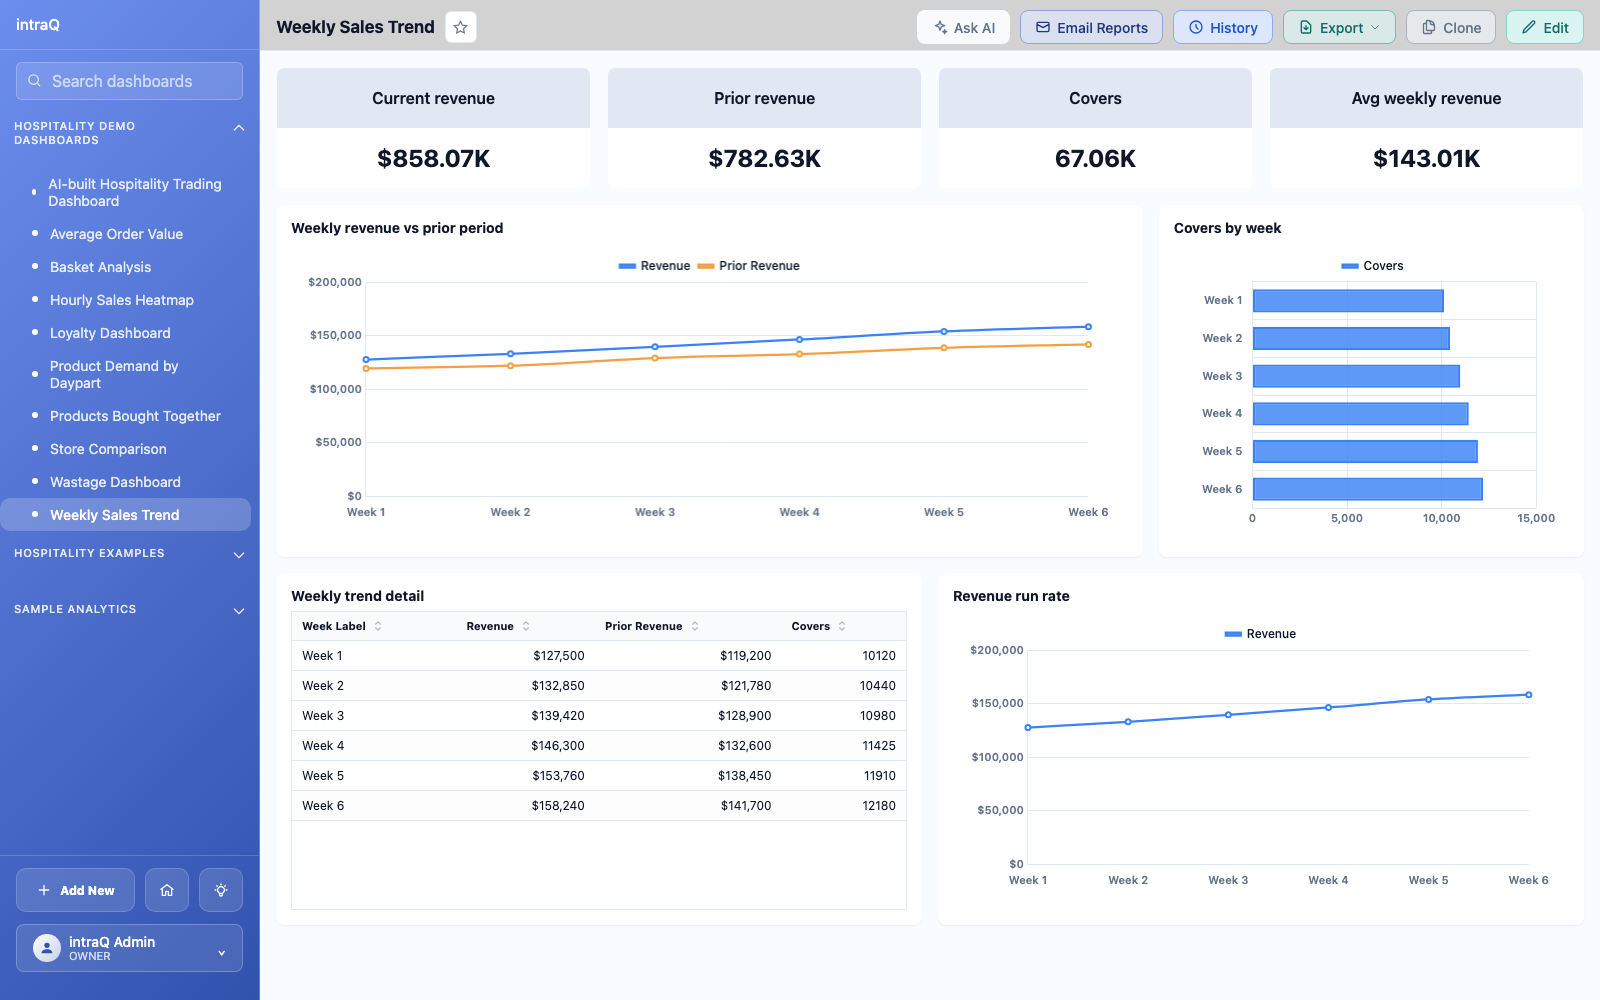
The weekly report answers "which venues and products are trending, and where do I focus?" It is for the operations lead or multi-site manager. This is where comparison matters most: venue against venue, week against week, product mix shifts, and daypart performance. For a group, a store-wise comparison ranking sites by revenue, covers, and average spend makes the underperformer obvious without stitching together separate exports.
- Venue-by-venue comparison — revenue, covers, average spend
- Week-over-week trend to separate a real problem from normal variation
- Product mix and top movers — what is rising and declining
- Daypart performance — where each part of the day is strong or weak
Period: the profitability report
The monthly or period report answers "did we actually make money, and where is margin leaking?" It is for the owner, finance, or franchise lead. This is the P&L-style view: prime cost (food plus labour) against the under-65% target, food cost against its band (25–35% depending on format), gross margin, and trends over several periods. This is the report that turns operating activity into a profitability verdict.
- Prime cost against the under-65% target — the single most important control number
- Food cost % against format benchmark (25–30% QSR, 30–34% casual, 34–40% fine dining)
- Labour cost trend and margin by venue
- Period-over-period comparison to catch slow drift before it becomes a problem
Match the report to the reader
A common mistake is sending everyone the same report. The GM does not need the period P&L every morning, and the owner does not need yesterday's void count. Good hospitality reporting is layered: daily trading for the venue manager, weekly performance for operations, period profitability for the owner and finance. Each person gets the numbers they can act on, at the cadence they act on them.
Moving from manual to automated reporting
The shift that changes everything is going from pull to push — from someone building a report to the report building itself. Automated reporting connects directly to your POS or PMS, applies consistent definitions of net sales, covers, and margin, and refreshes on its own. The manager opens the daily trading report instead of assembling it; the owner sees the period view without waiting for month-end. The hours previously spent in spreadsheets go back into running the business, and the numbers are current instead of stale.
The one requirement for automation to be worth trusting is consistent definitions. If "revenue" means something different across venues — different discount handling, different void treatment — an automated report just produces wrong numbers faster. The reporting layer has to hold one agreed definition of each metric, applied everywhere.
Why reporting is only as good as its trust
A report drives a decision, and a decision made on a number you cannot verify is a guess. The best hospitality reporting shows its work — where the number came from, how it was calculated, what was included or excluded — so the person acting on it can trust it. This matters most for anything that reaches finance or ownership, where a confidently wrong number does real damage.
How intraQ handles hospitality reporting
intraQ connects to your own POS or PMS data and turns reporting from a manual chore into a question you can ask in plain English. Ask for yesterday's trading, this week's venue comparison, or the period prime-cost view, and intraQ returns it with the SQL and evidence visible, then saves it as a live report that refreshes on its own. Because every metric is grounded in the Knowledge Layer — one agreed definition of net sales, covers, and margin — the numbers stay consistent across every venue and every report, and you can trust them enough to act.
Frequently asked questions
What is hospitality reporting? Hospitality reporting is the practice of turning POS and PMS data into regular, structured views of business performance — daily trading, weekly trends, and period profitability — so operators can act on how the business is doing.
What reports do hospitality operators need? At a minimum: a daily trading report (net sales, covers, average spend, labour %), a weekly performance report (venue comparison, product mix, trends), and a period profitability report (prime cost, food cost, margin). Each belongs to a different cadence and a different reader.
How do you automate restaurant or hotel reporting? Connect a reporting tool directly to your POS or PMS, define each metric once so definitions stay consistent across venues, and let reports refresh on their own instead of being rebuilt in a spreadsheet. intraQ does this from plain-English questions, with the SQL visible for trust.