How to increase average order value in a restaurant (proven strategies)
Average order value grows revenue without needing more customers. Here are the proven levers — menu engineering, placement, bundling, digital menus, and loyalty — with their verified impact.
· 8 min read
Average order value (AOV) is the average amount a customer spends per transaction — total revenue divided by the number of orders. Increasing it is one of the most efficient ways to grow a hospitality business, because it lifts revenue without needing a single extra customer through the door. Even a one- or two-pound increase compounds across thousands of orders.
The levers that raise AOV are well understood and measurable. Here are the proven strategies, ordered roughly by impact, with the verified figures behind each.
1. Menu engineering (the biggest lever)
Classifying menu items by margin and popularity, then promoting the profitable ones and fixing or cutting the rest, adds 10–15% to the bottom line when done consistently. Since around 80% of sales come from just 16% of items, the priorities are few. This is the foundation — the other tactics amplify it.
2. Menu placement and design
Where an item sits on the menu changes how often it sells. High-margin items placed in the menu's "Golden Triangle" — the zones the eye naturally lands on — see selection rise by around 60%. Simply boxing an item or adding an icon lifts it by roughly 18%. These are near-free changes that work on both printed and digital menus.
3. Bundling and combos
Combo deals reduce decision fatigue and raise basket size. They account for 35–50% of orders where offered and add $4–6 to average order value each. The trick is pricing the bundle 5–10% below the à la carte total — enough to feel like value, while still lifting the overall transaction margin by pairing a low-margin item with a high-margin one.
4. Digital menus and kiosks
Digital ordering — kiosks, tablets, online and app ordering — lifts average order value by 15–30%. The reason is simple: the screen suggests the add-on every single time, without the social friction that stops staff upselling. Highlighting a high-margin item on a digital menu raises its selection by 40–60%, and category-level prompts (for example on pizza) have been shown to add $8–12 per order.
5. Staff upselling
In full-service settings, trained staff remain a powerful lever. Suggestive selling — describing items appetisingly, recommending an add-on at the right moment — typically lifts AOV a few percent, and pairing training with a small performance incentive keeps it consistent. It costs little and usually pays back within a couple of months.
6. Loyalty
Loyalty members spend 12–25% more annually than non-members, and they are more likely to try new and premium items — so they are the right audience for higher-value offers. Rather than blanket discounts, target offers by segment using purchase history, which raises spend without eroding margin.
How intraQ finds and closes the gap for you
The hard part is not knowing these levers exist — it is spotting exactly where you are leaving money on the table, for which customers, and what to do about it. That is the gap intraQ closes. Instead of waiting for you to go looking, it proactively surfaces the gap in your process, hands you the specific lever, and then proves whether the action worked.
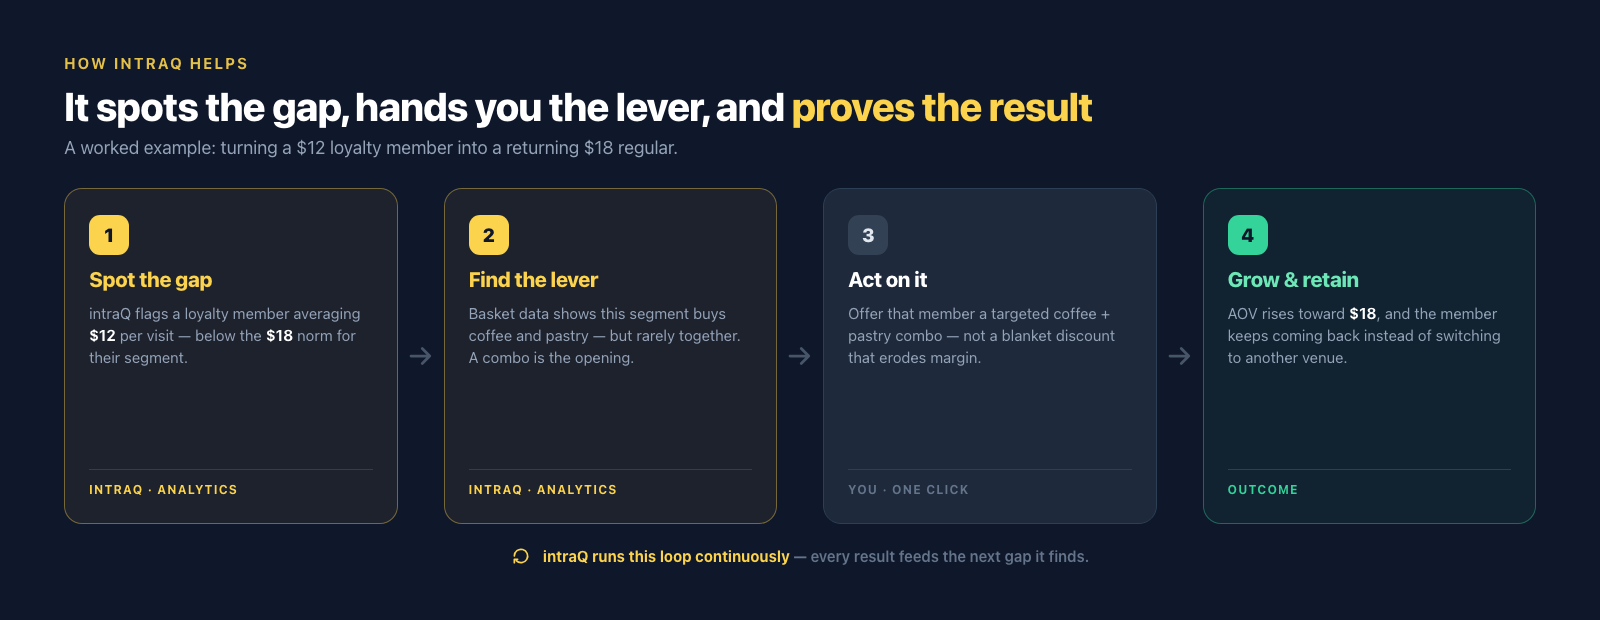
Take a real example. A loyalty member is spending about $12 a visit, while the rest of their segment averages $18. A generic report would never flag this — the customer looks fine in the totals. intraQ spots that they are below their segment, then looks at the basket data and sees this group tends to buy coffee and a pastry, but almost never together. That is the opening. Rather than blast a blanket discount that trains every customer to expect money off, you offer that member a targeted coffee-and-pastry combo. Their average order value moves toward $18, and — just as importantly — they keep choosing you instead of the restaurant down the street. intraQ then measures whether it worked and moves on to the next gap.
That is the difference between a dashboard and intraQ. A dashboard shows you the $12 number if you go looking for it. intraQ tells you the customer is underspending, why, what to offer, and whether the offer paid off — grounded in your own POS data, with the numbers behind every recommendation visible. It is proactive analytics that closes the loop from insight to action to result.
Frequently asked questions
How do you increase average order value in a restaurant? The proven levers are menu engineering (10–15% bottom-line impact), high-margin menu placement (around 60% higher selection), combo bundling (+$4–6 per order), digital menus and kiosks (15–30% AOV lift), staff upselling, and targeted loyalty offers.
What is average order value? It is the average amount spent per transaction — total revenue divided by the number of orders. Raising it increases revenue without needing more customers.
Do digital menus and kiosks really increase spend? Yes — digital ordering lifts average order value by 15–30%, because the screen consistently offers relevant add-ons and highlights high-margin items without relying on staff to upsell.